An observability platform for a mainframe migration
Commercial-APM capability — distributed tracing, RUM, load testing and alerting — assembled from open source, on a billing system being moved off a mainframe.
A billing system was being moved off a mainframe onto Azure. The team wanted the kind of visibility a commercial APM product gives — distributed tracing, real user monitoring, automatic service maps — without the licence cost that comes with it. I built that from open source and ran it against the real application.
What it is
An OpenTelemetry pipeline feeding a Grafana stack:
application ──► OTel Java agent ─┐
                                 ├──► collector ──┬──► Tempo (traces)
browser ──────► Faro ────────────┘                ├──► Loki (logs)
                                                  └──► Prometheus (metrics)
The agent instruments the server side. Faro is the same idea in the browser — page timings, JavaScript errors and user sessions, reported into that same collector, so a slow page and the query behind it end up in one trace. Grafana is absent from the diagram on purpose: nothing is pushed to it, it queries all three stores as datasources.
Fifteen dashboards sit on top, with a single overview as the entry point and everything else reachable by clicking through from it.
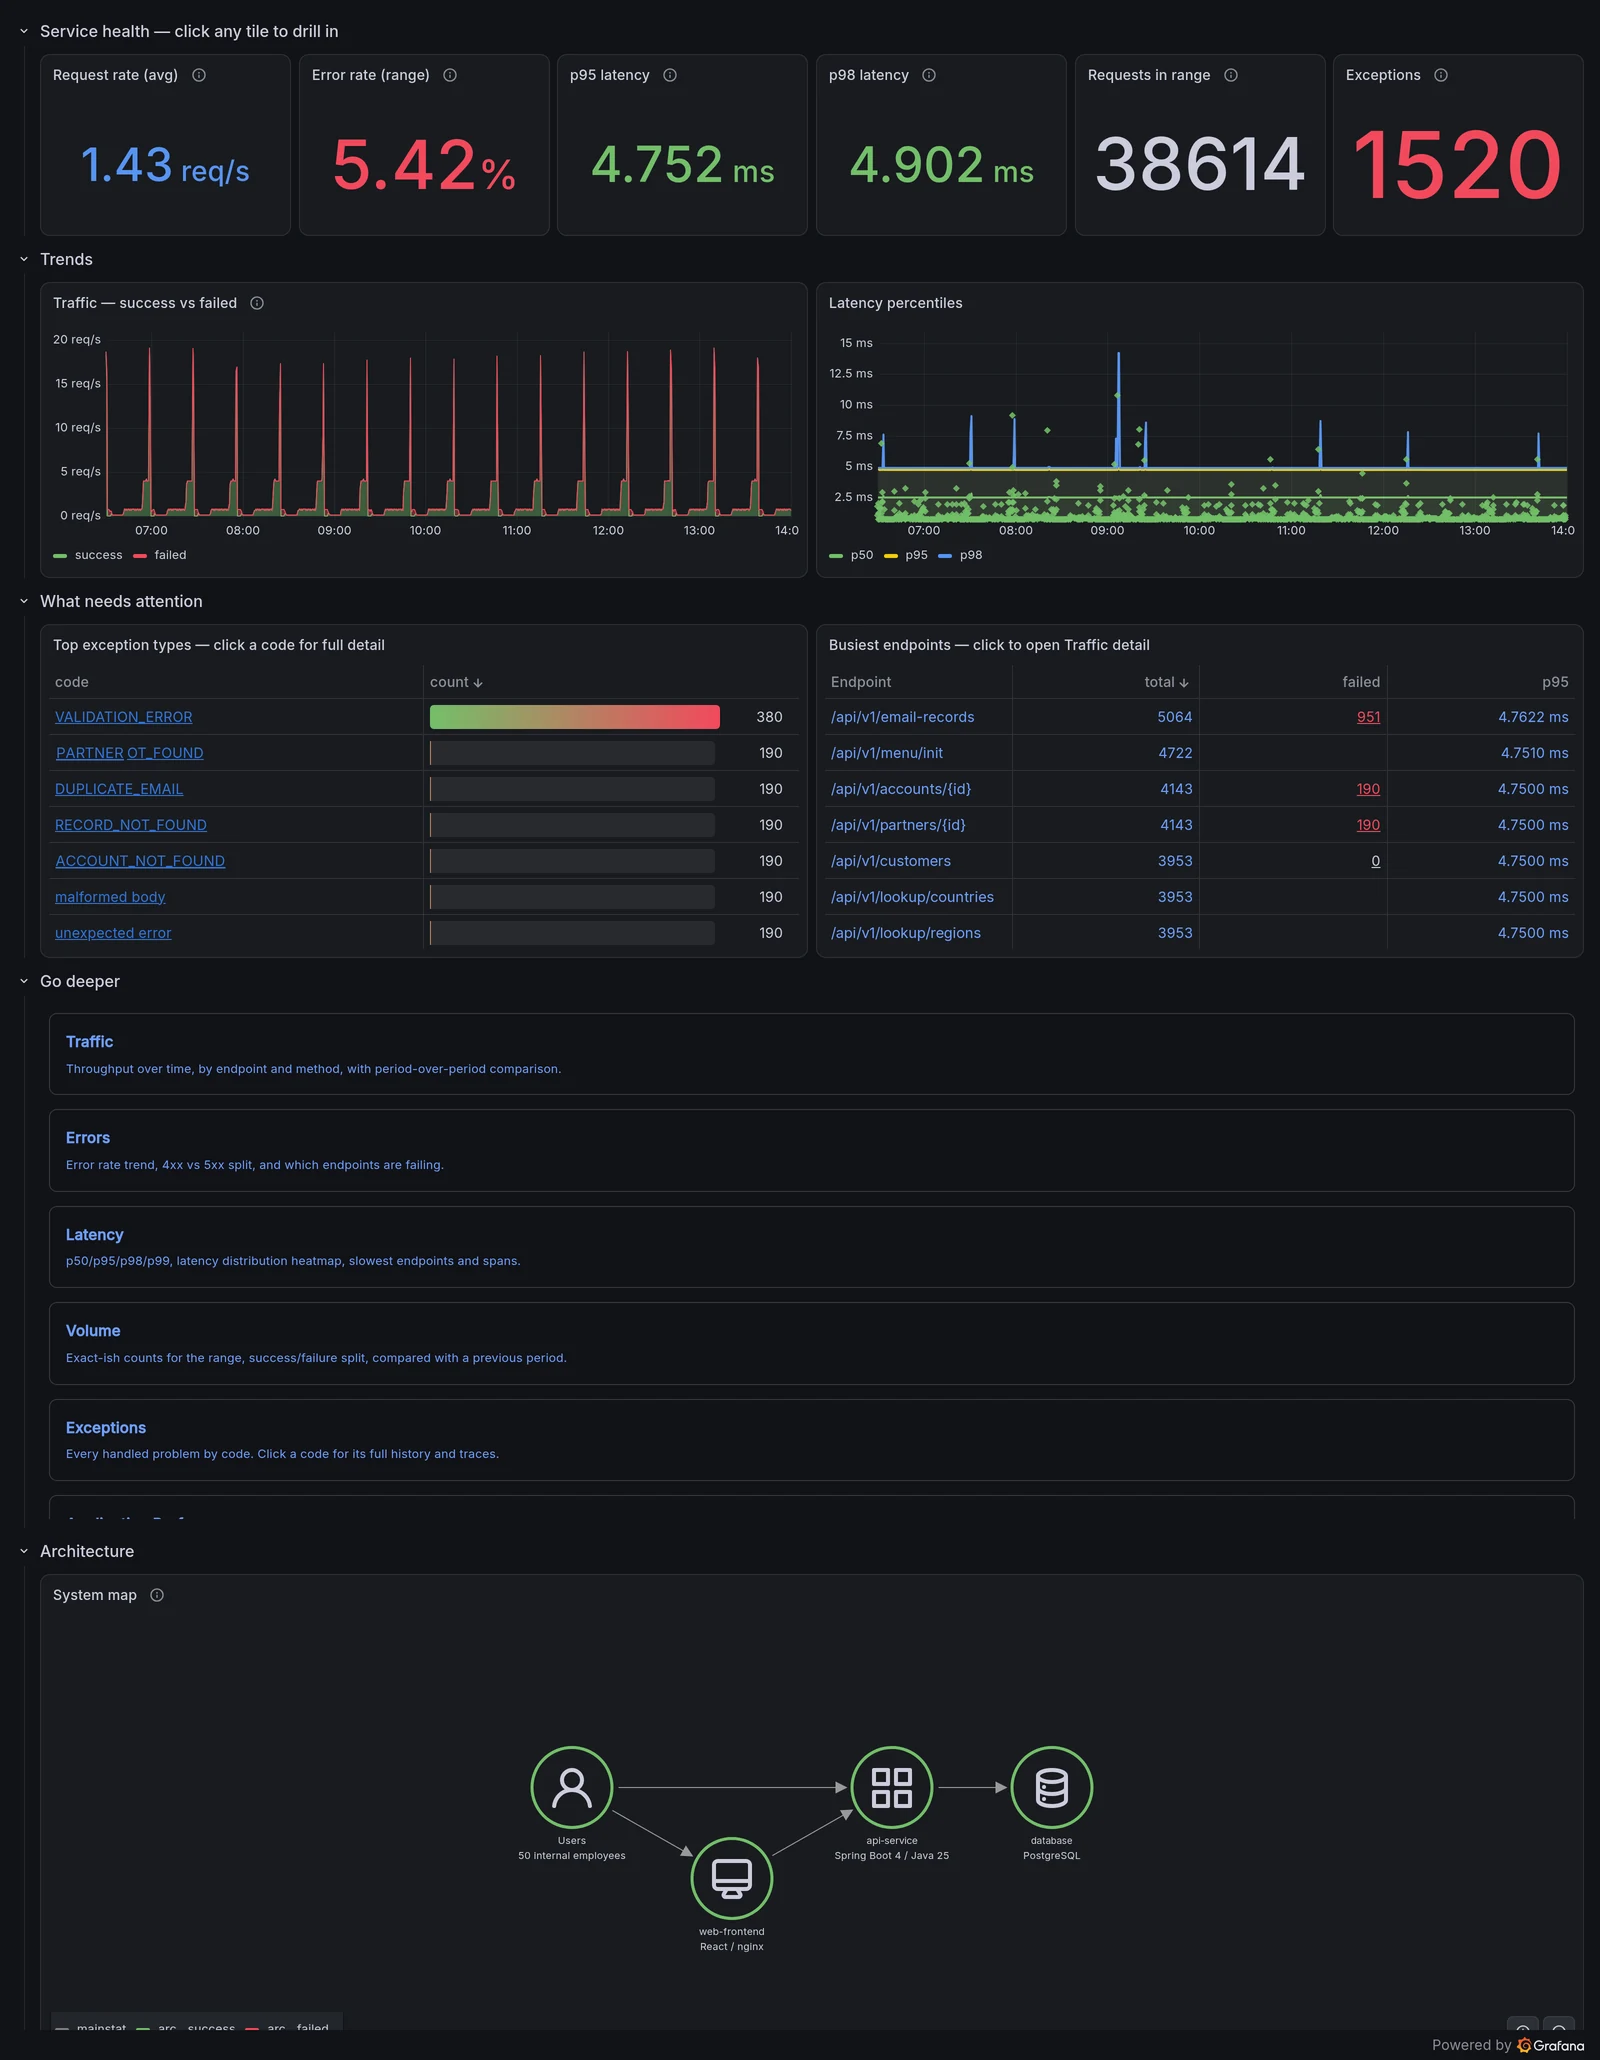
A note on the screenshots: service, endpoint, table and class names have been replaced with generic ones, and a few identifiers are blanked out. The numbers are unedited. The traffic is synthetic — eight hours of scripted load against a local copy of the application, with deliberate error bursts — so read the shapes, not the business.
Instrumentation without touching the application
The application was already written. Its container entrypoint passed $JAVA_OPTS
through to the JVM, so the OpenTelemetry Java agent could be attached by mounting
the jar and setting one environment variable — no code change, no rebuild, no
redeploy of a modified image.
The result is code-level detail the team had not had before. A single request produces a span tree that reaches all the way to the SQL:
142.89 ms  GET /lookup/regions
  1.02 ms    HikariDataSource.getConnection
 92.41 ms    LookupRepository.findByParentCode
 61.56 ms      SELECT …
  5.09 ms        SELECT (SQL text captured)
  1.50 ms    Transaction.commit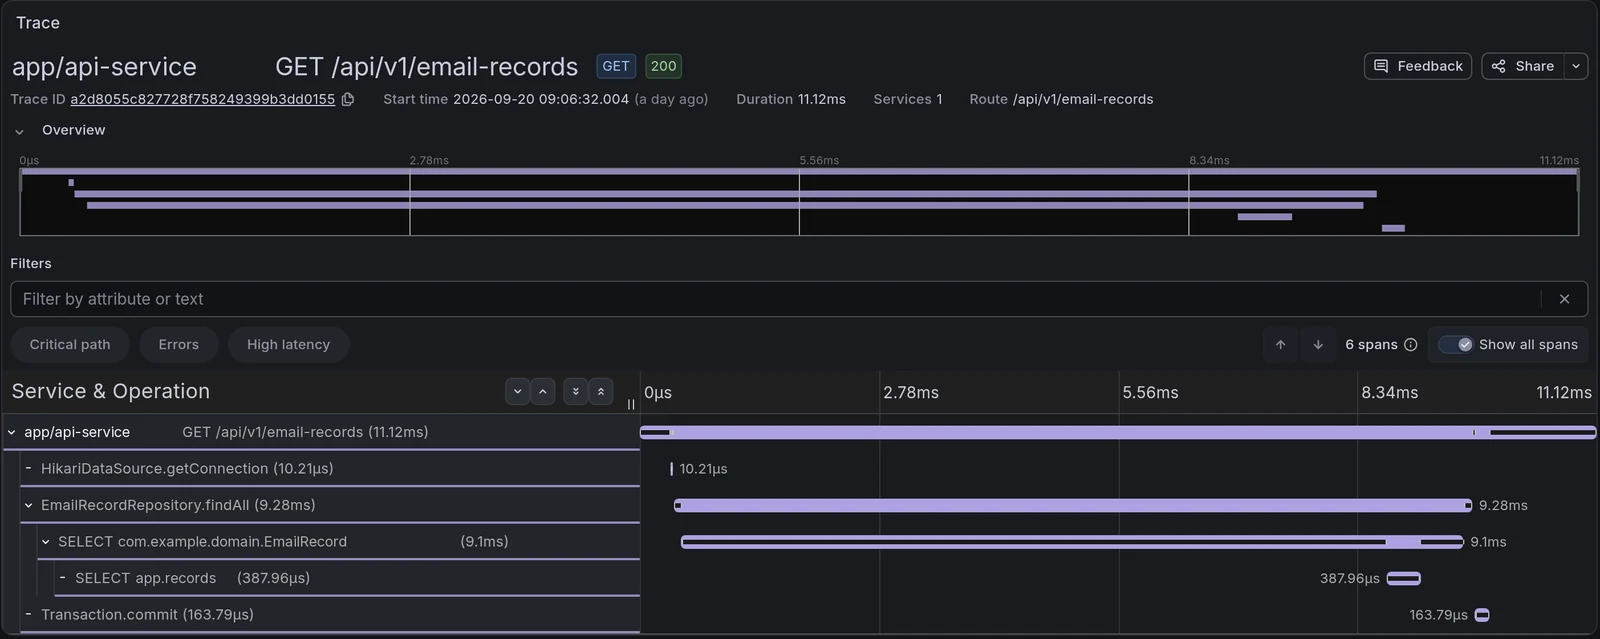
What it measured
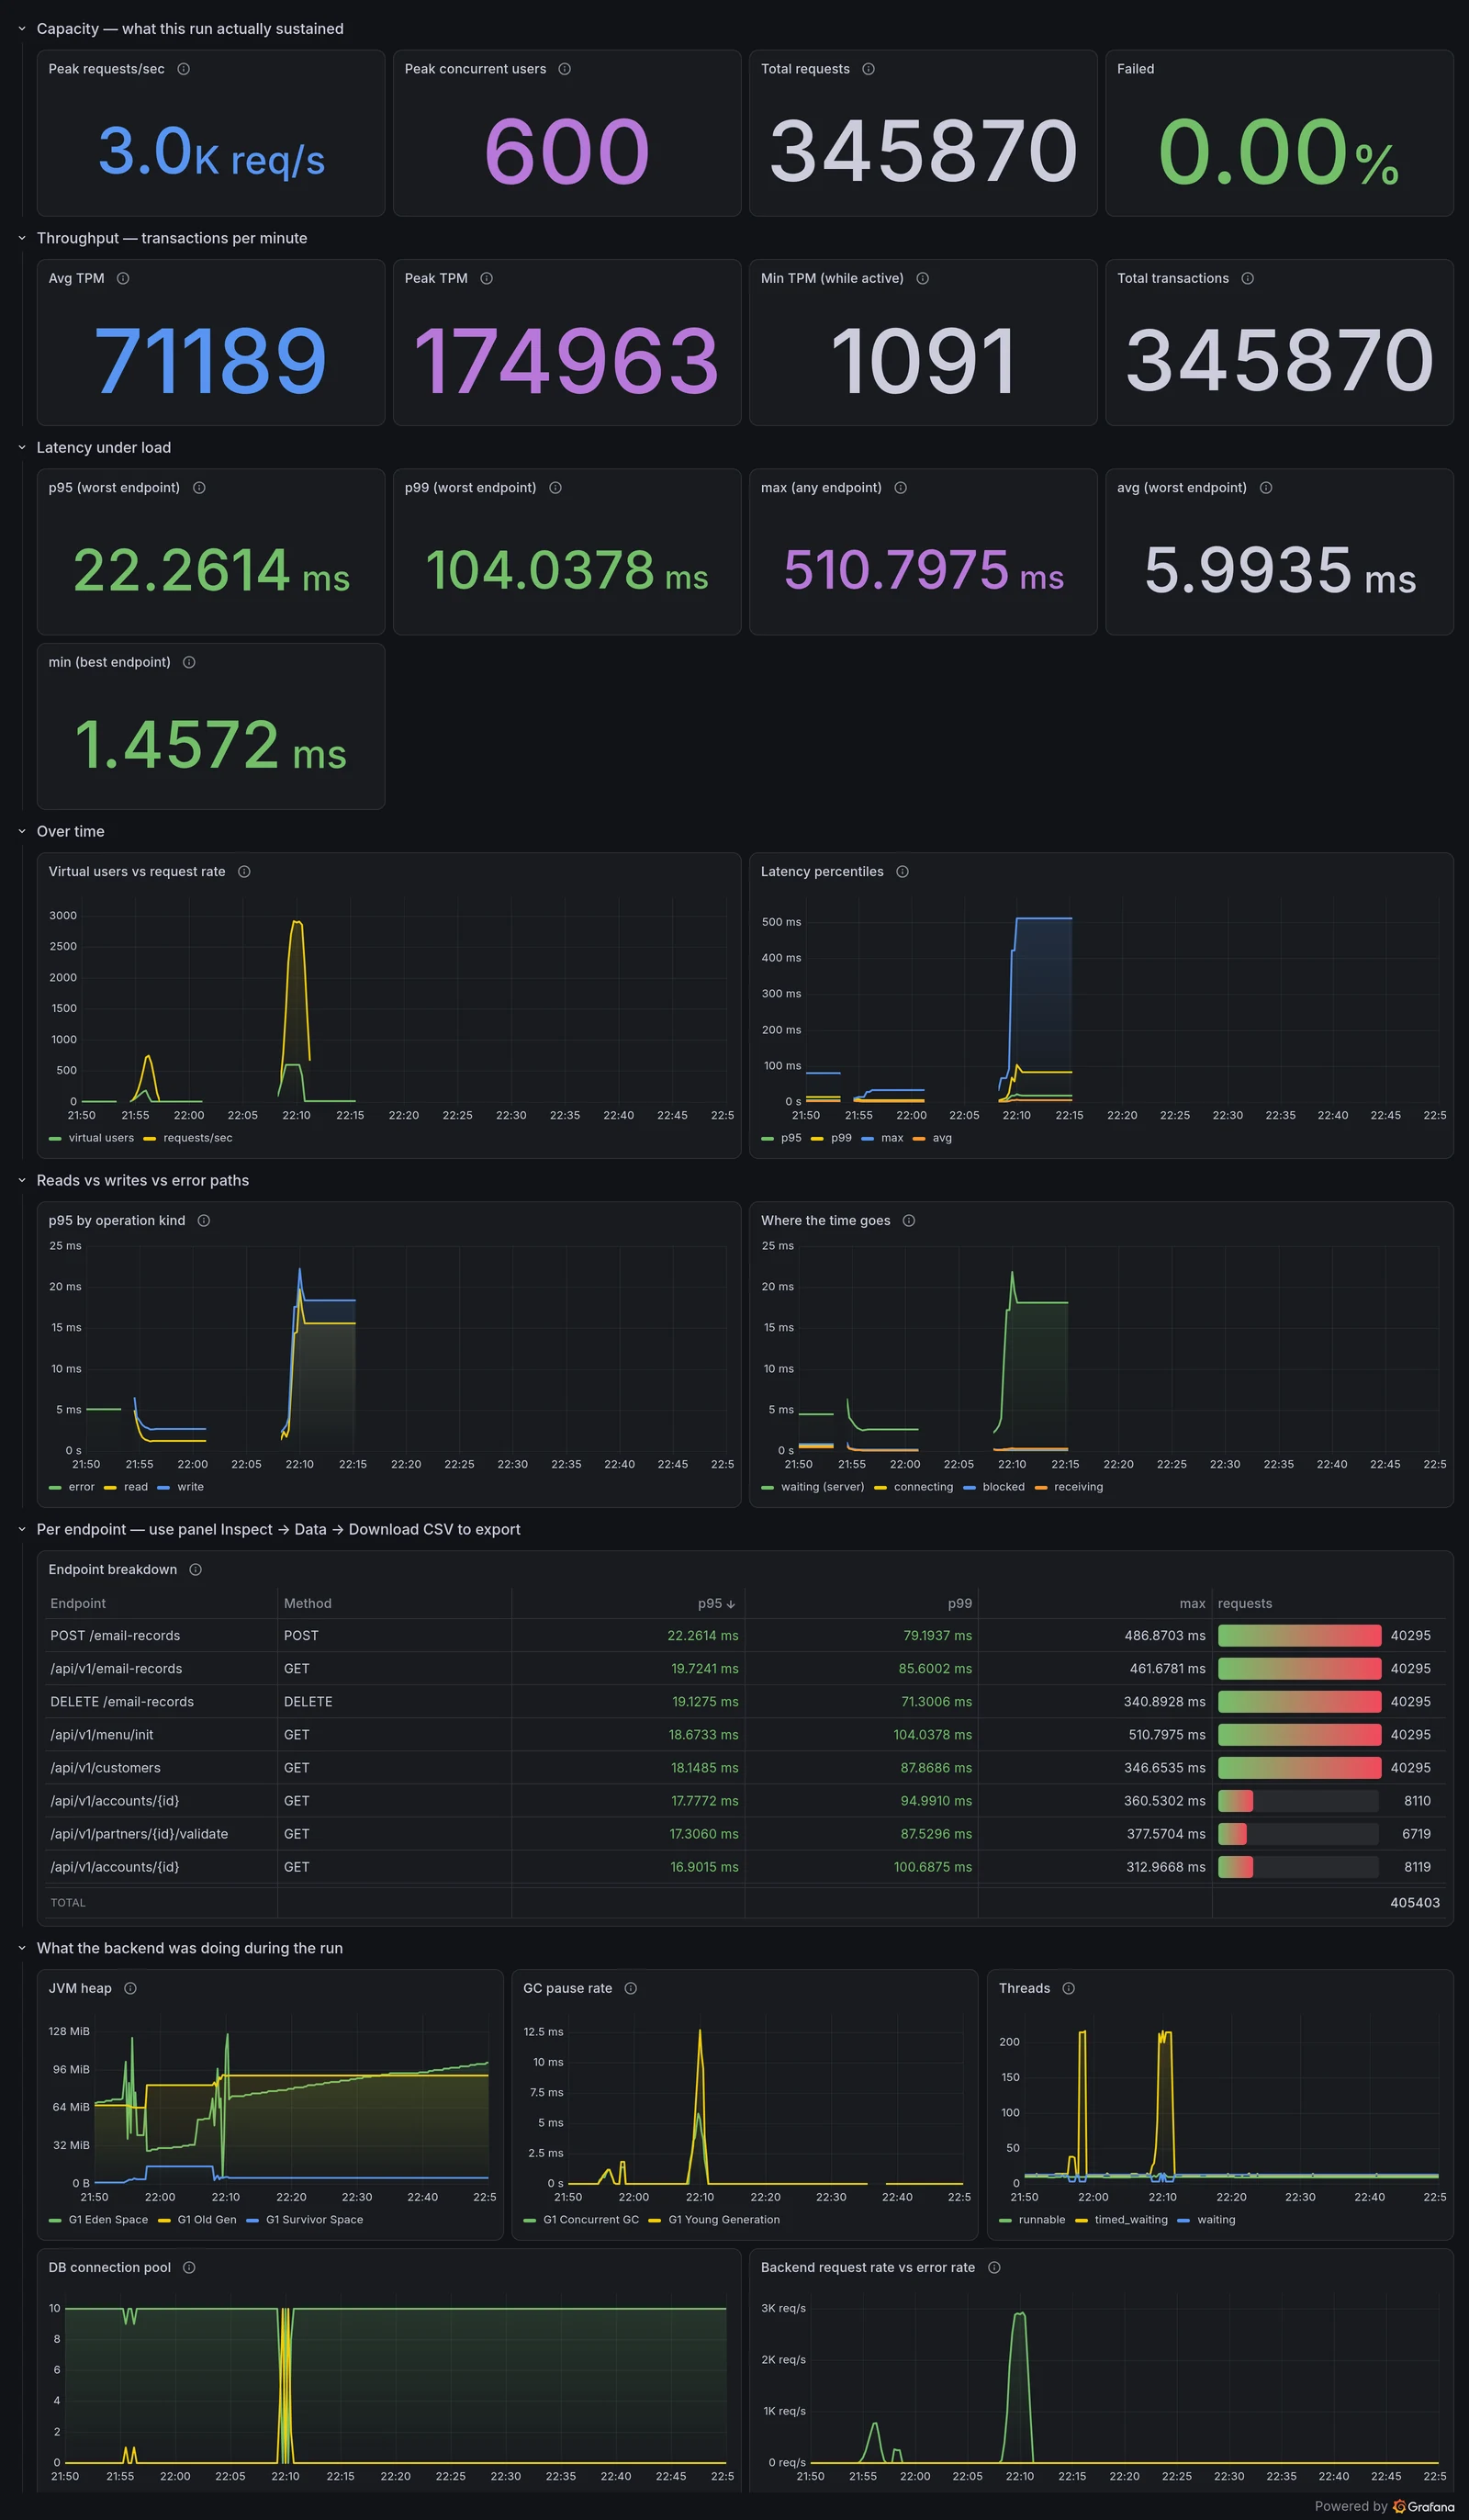
Capacity was established with k6 for realistic user behaviour, and with Apache
Bench for saturation, because the two answer different questions. k6 models users
with think-time and answers “does it cope with N people”. ab sends a wall of
traffic and answers “where is the ceiling”.
| Metric | Value |
|---|---|
| Peak sustained throughput | 2,916 req/s |
| p95 under load | 13.8 ms |
| Saturation knee | 25 concurrent |
| Largest single run | 345,870 requests, 0 failures |
The knee matters more than the peak. Past 25 concurrent requests, throughput stopped improving while latency kept climbing — past that point the system is queueing, not working. That is the number to scale on, and it is a better signal than CPU for a request-driven workload.
What it found
Things that were already true, and that nobody could see before:
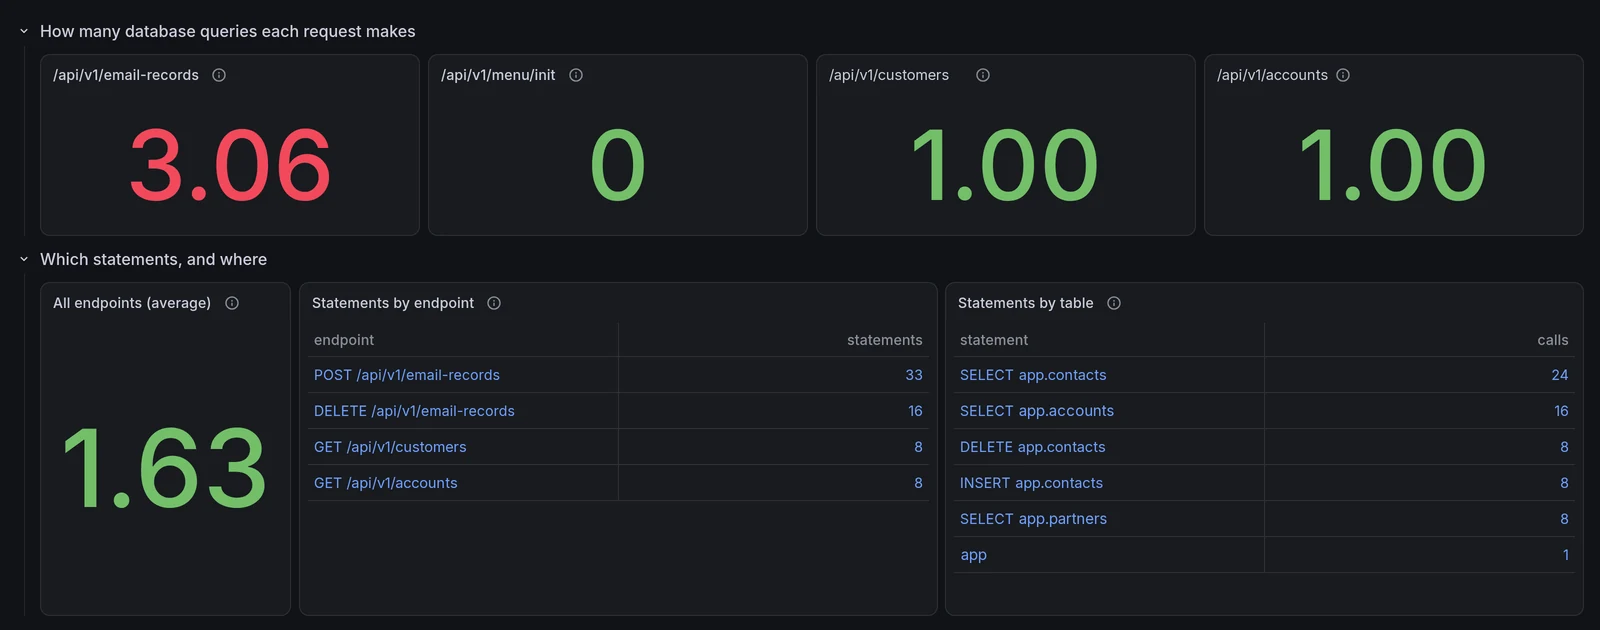
- A repeated query. One page load issued three separate reads of the same table, the third accounting for more than half the server time. Invisible at development data volumes; expensive at production ones.
- Batch steps losing rows. Spring Batch records read, filter, write and skip
counts per step.
read − filter − write − skippedshould be zero. Surfacing that as a column turned a silent gap into something you can alert on — which matters when the rows are billing records. - A client error reported as a server error. An unsupported content type fell through to the catch-all handler and returned 500 instead of 415. That inflates the 5xx error budget and would page someone at night for a malformed request.
The repeated query was found by opening a trace and counting. That is the wrong way round, so it became a dashboard: database statements divided by requests, per endpoint. One query per request is normal; anything above that is a read the endpoint is doing more than once.
The dashboards
Each one answers a single question, and each opens from the overview. Tiles that compare with the previous day read “no data” because there was no traffic the day before to compare against.
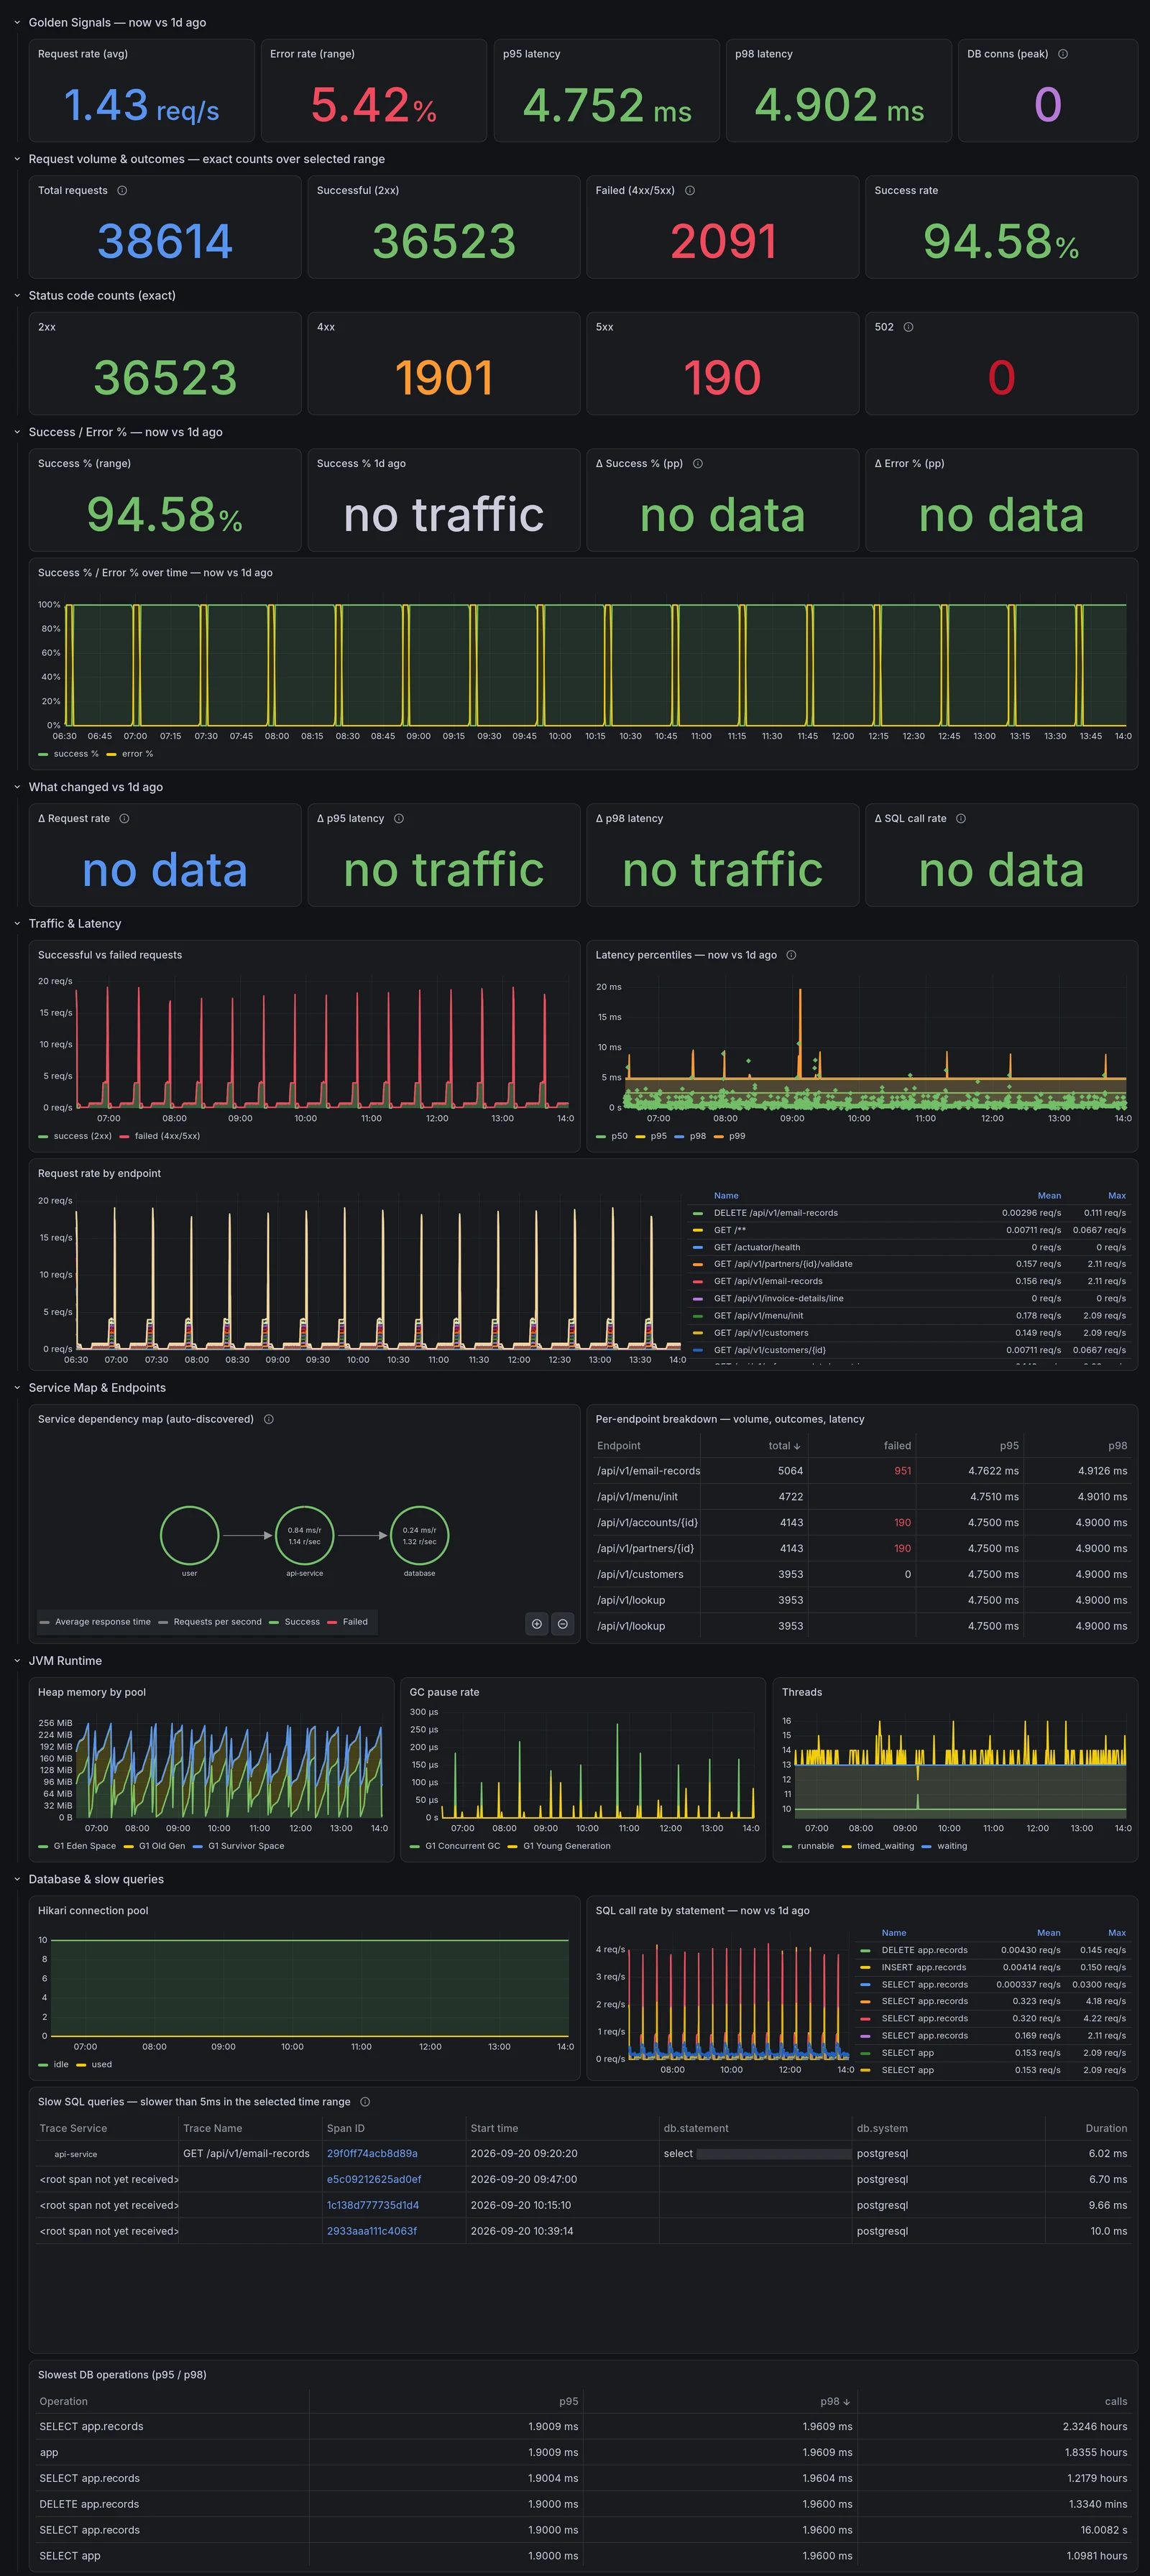
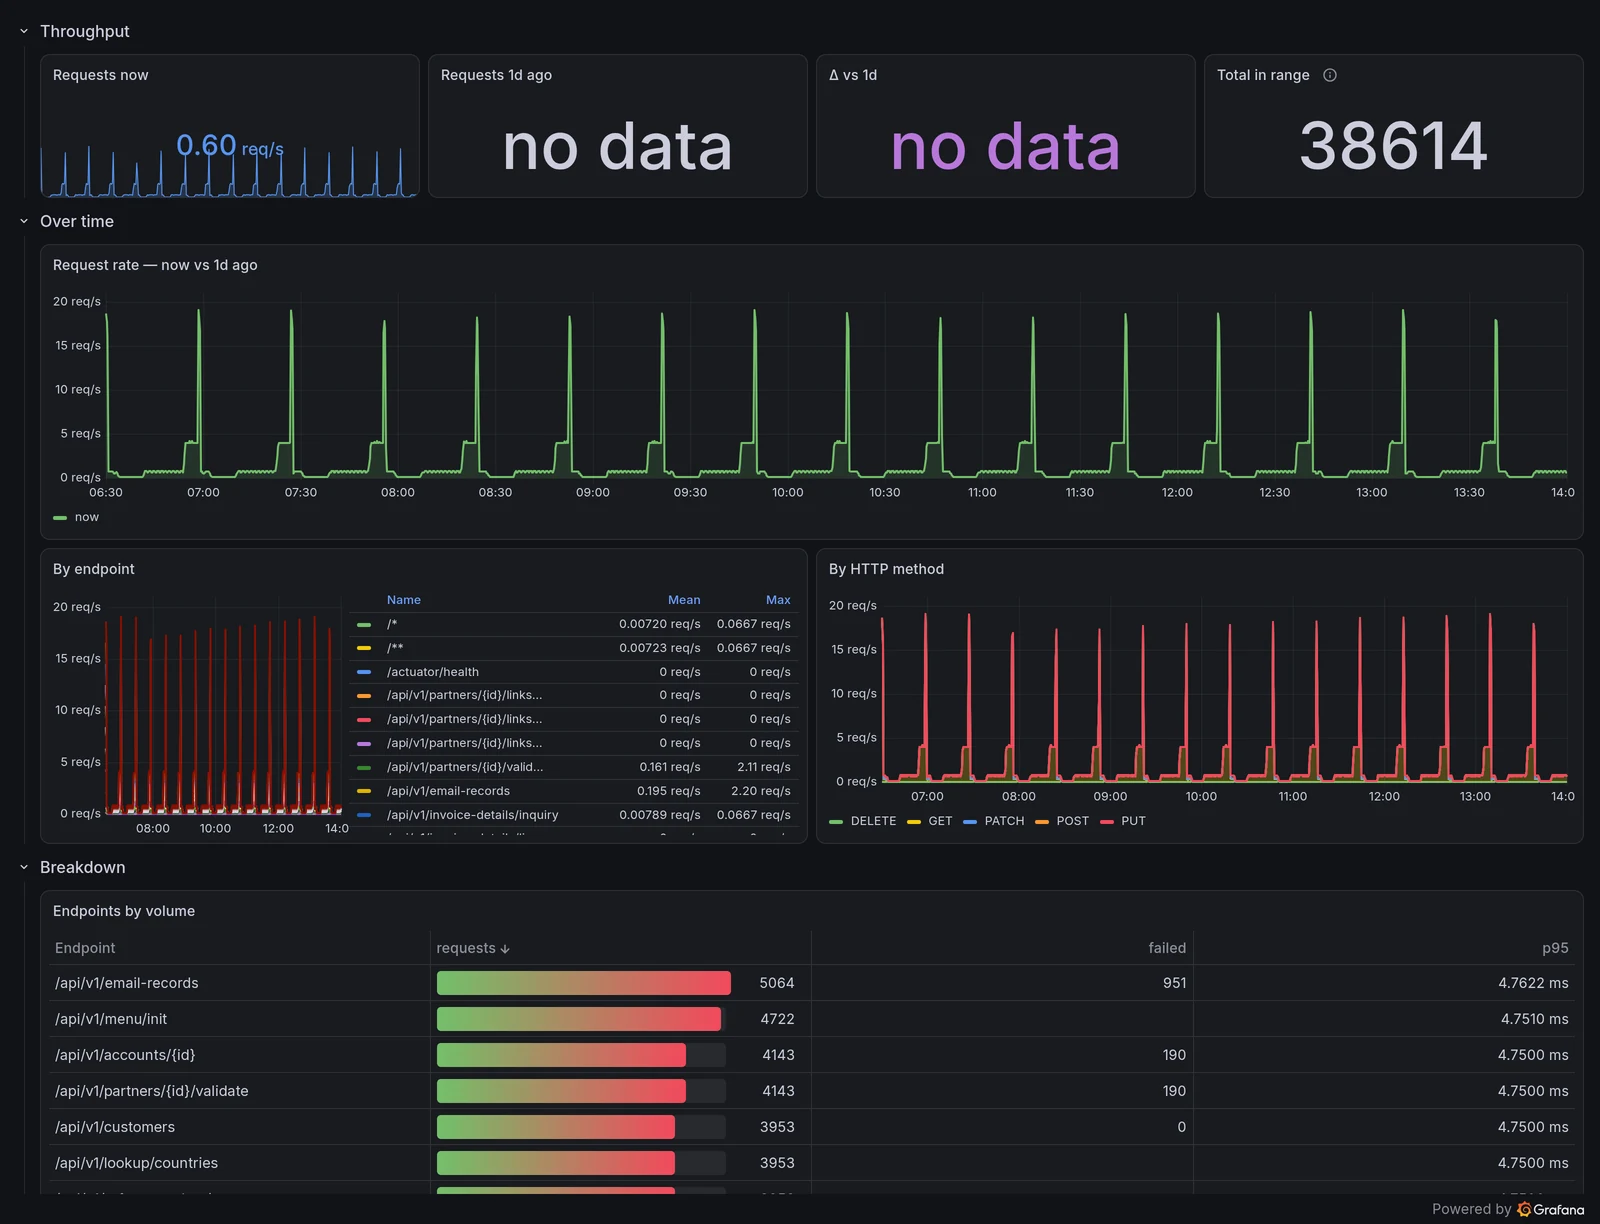
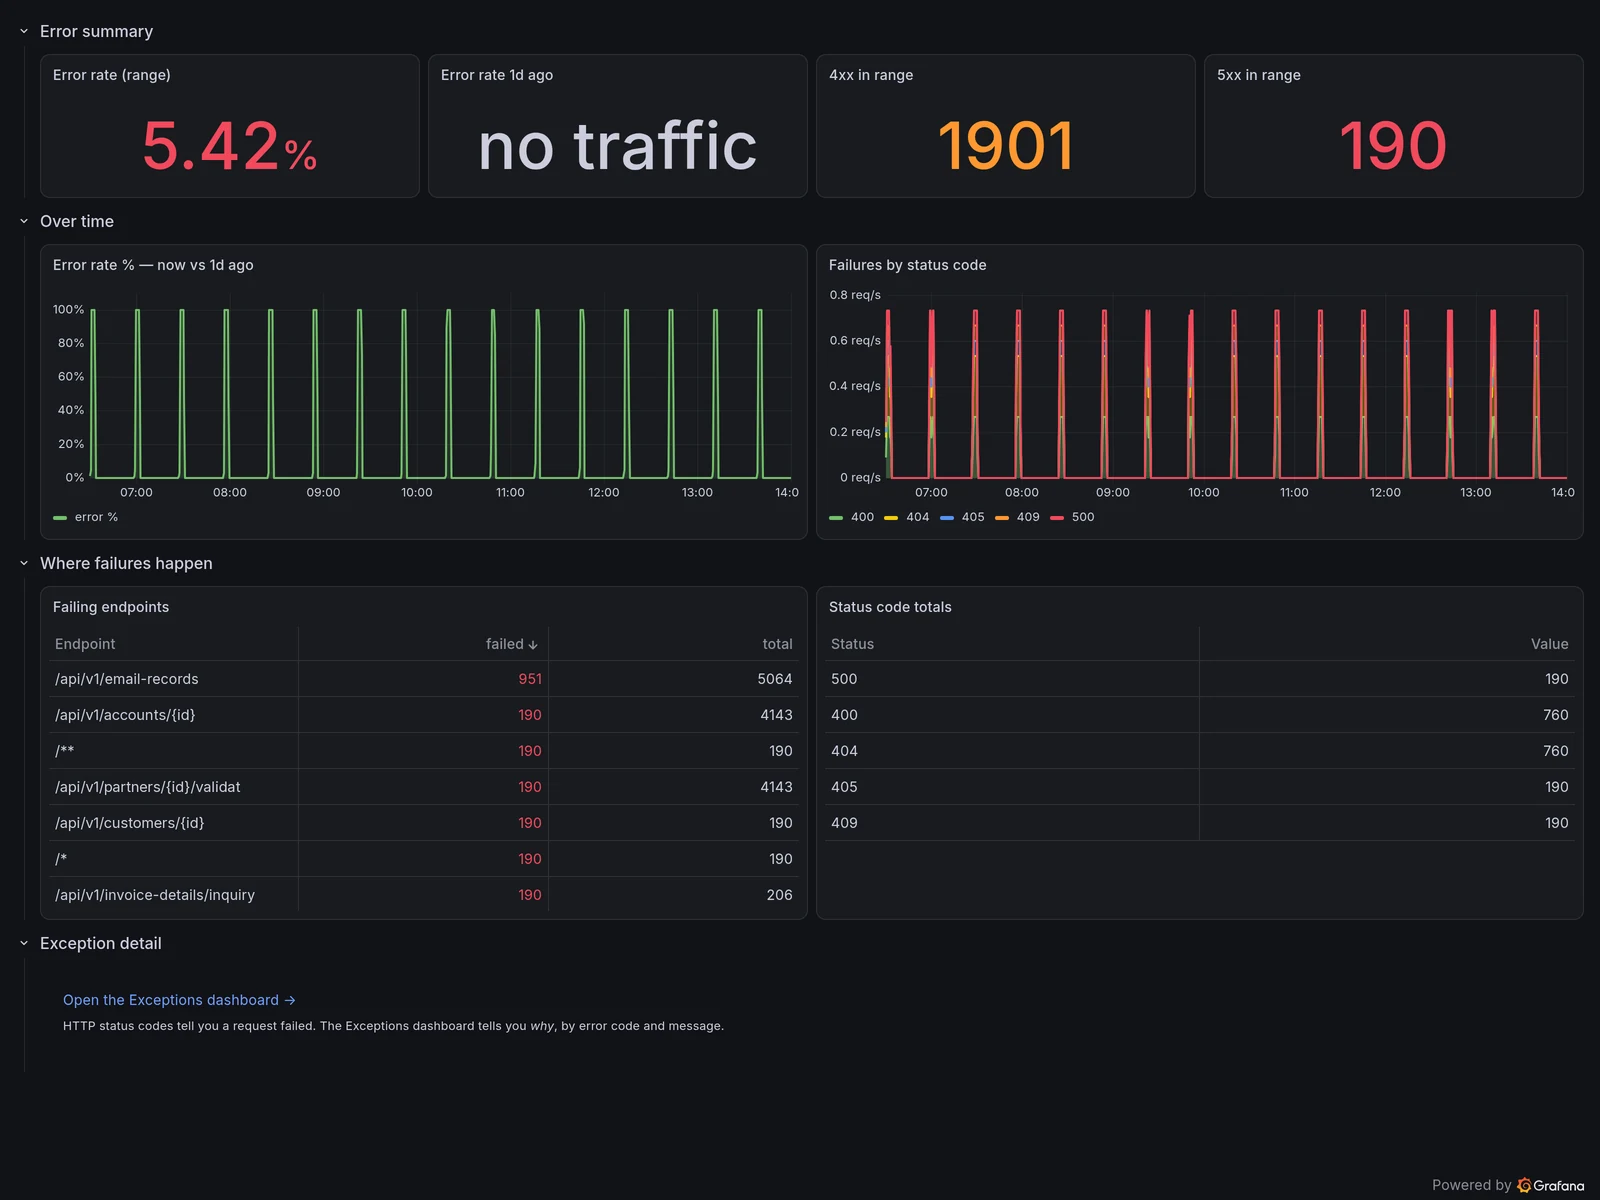
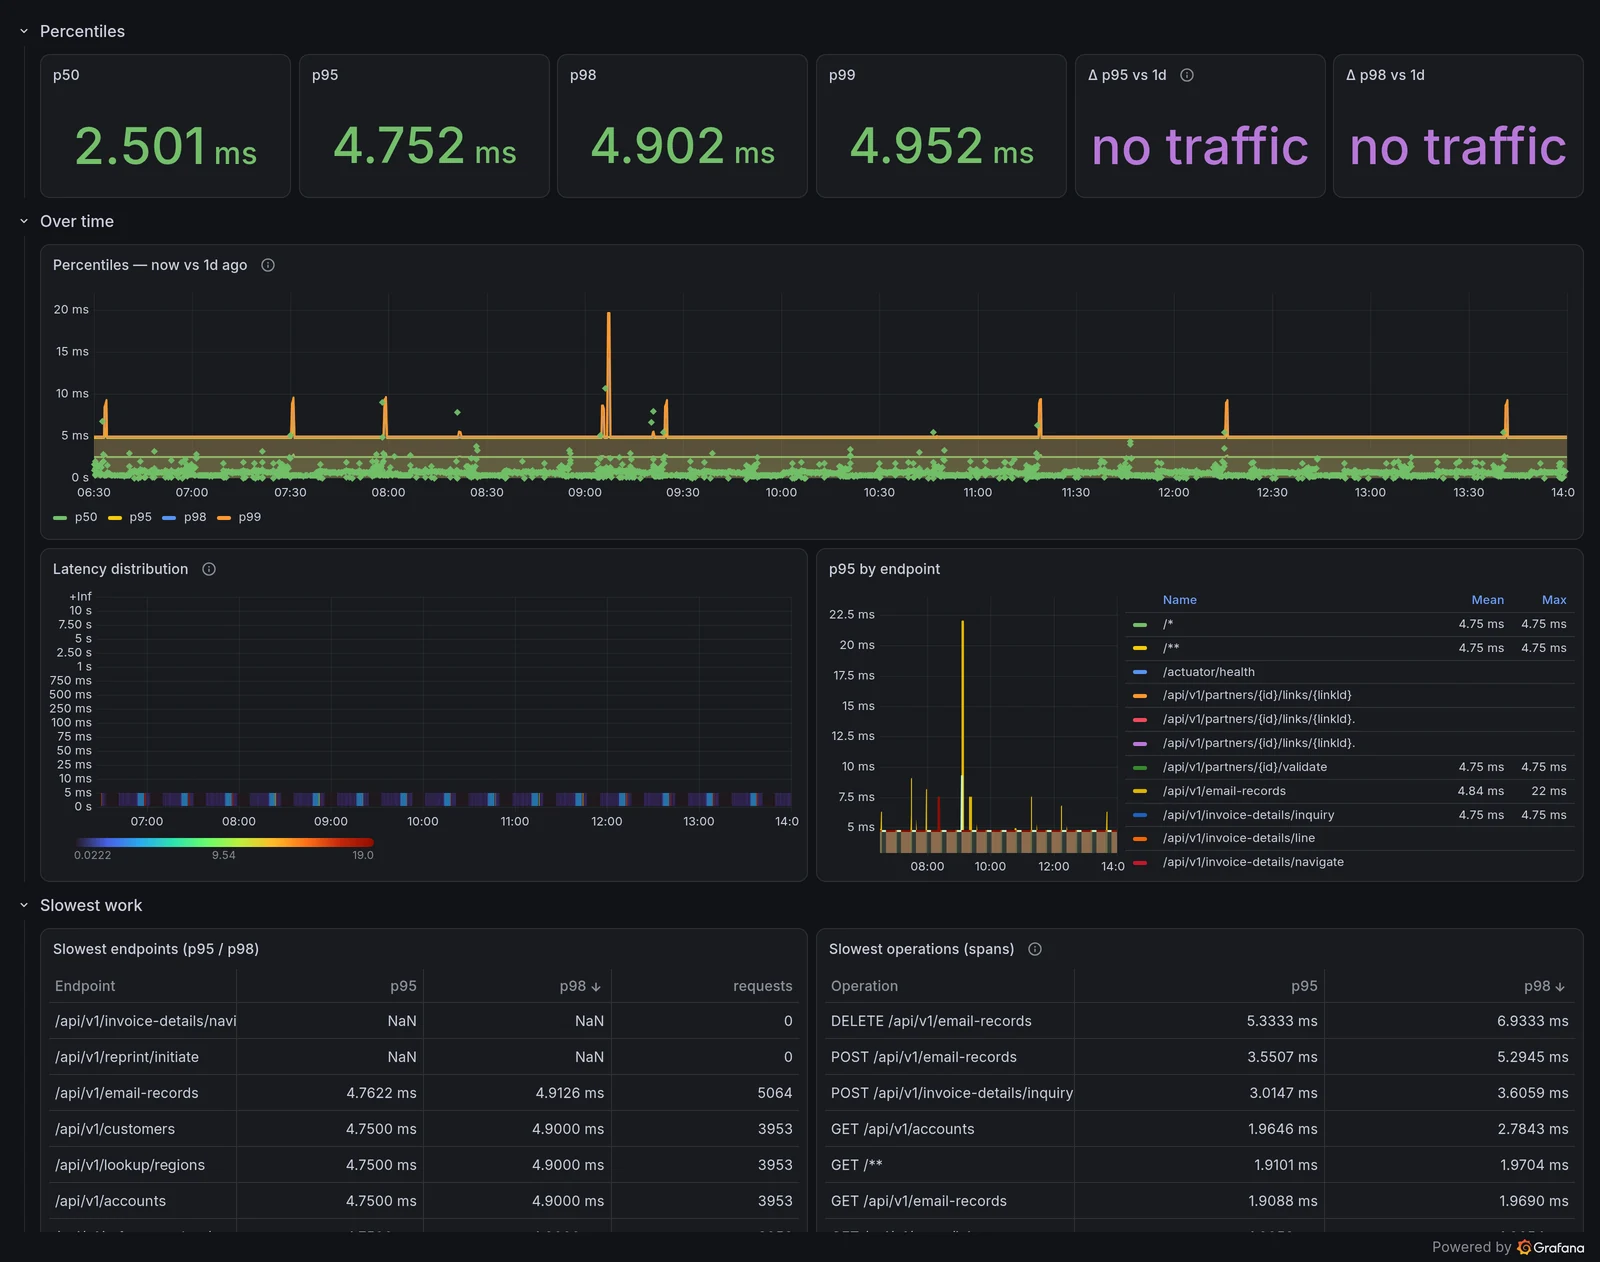
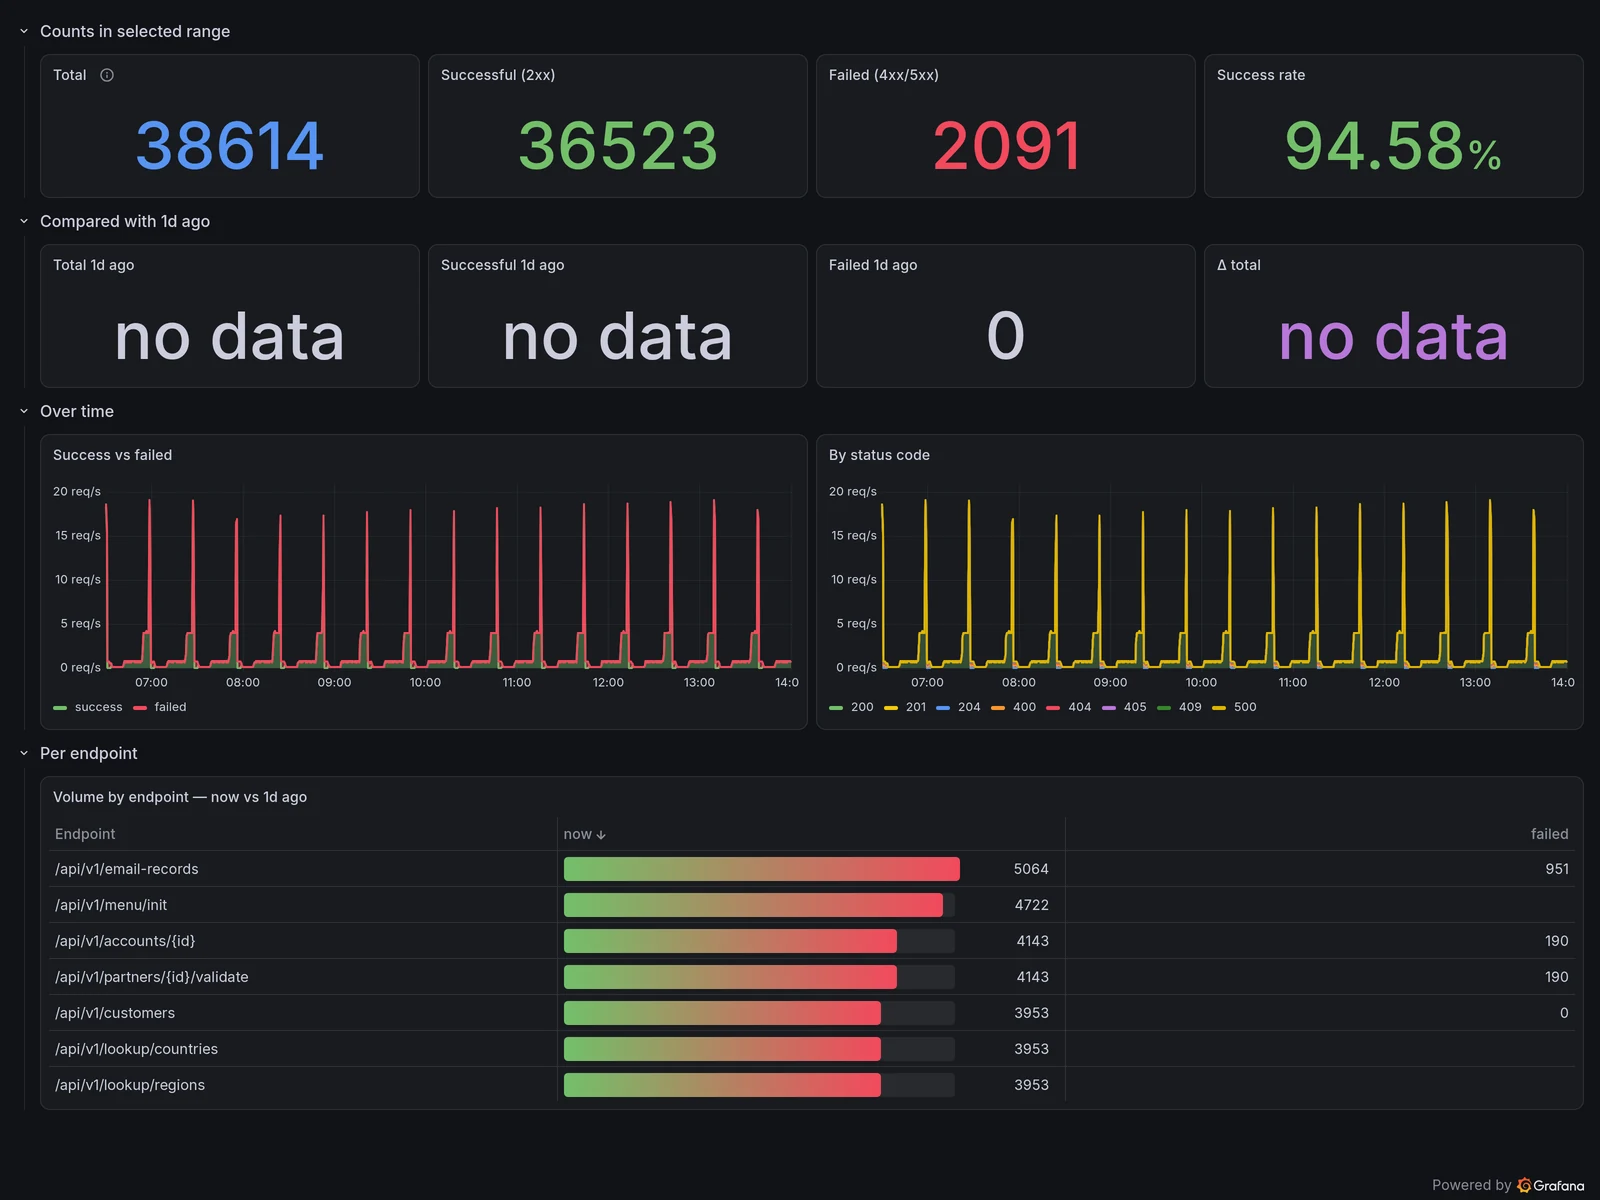
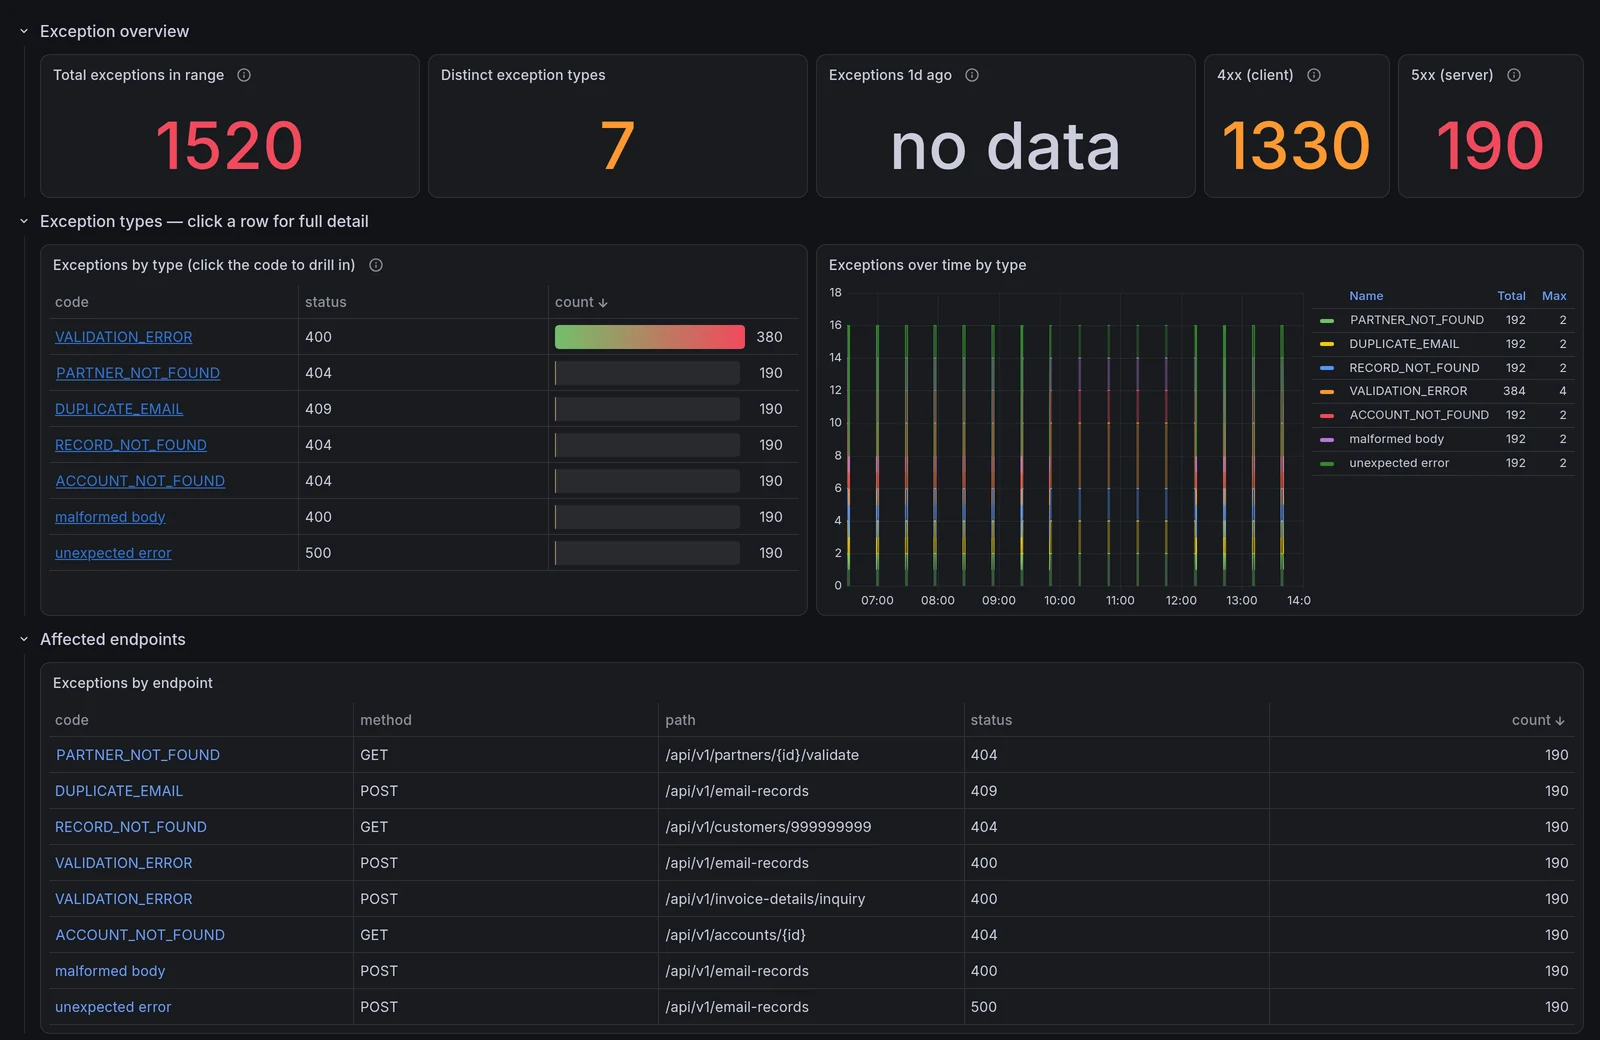
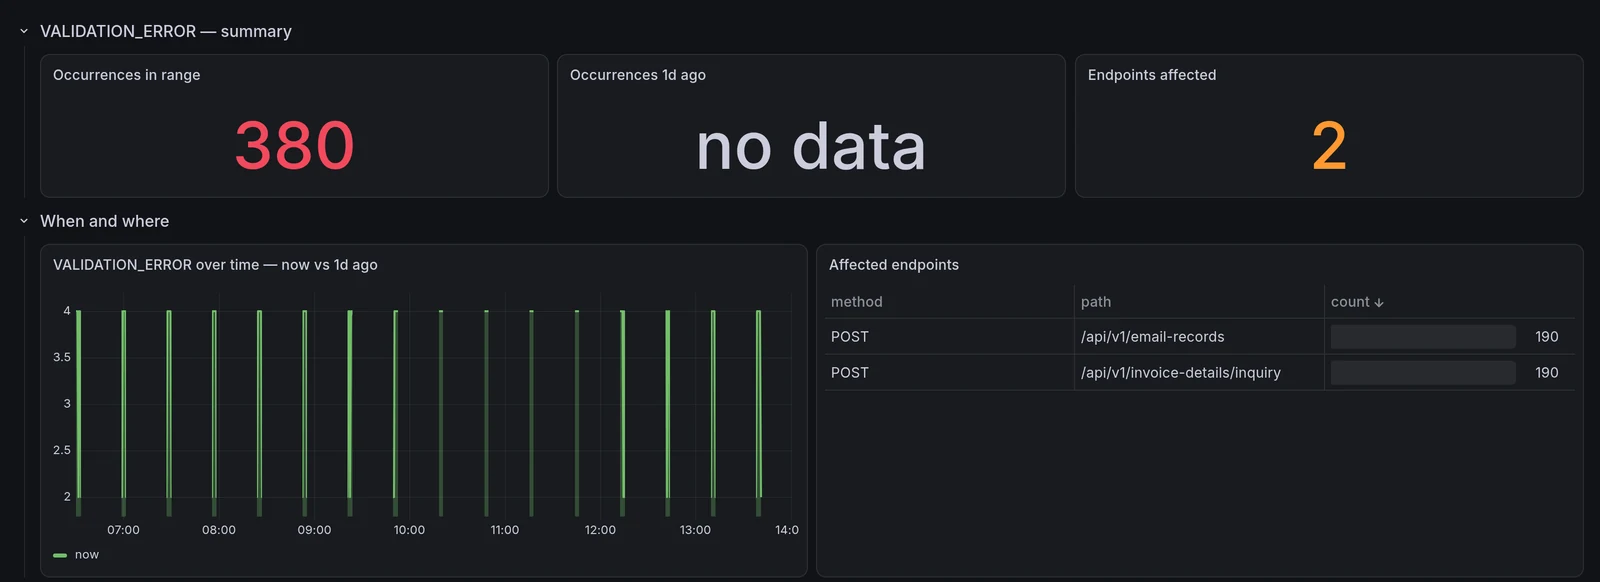
Five more are not shown. Two track business activity — one from API traffic, one read directly from the database — and a third checks that each environment’s seed data matches its baseline; every panel on those three is the client’s own domain. The batch-job dashboard had no runs to show locally, and the trace lookup is the view already shown above.
What went wrong
Counting is harder than it looks. I started with raw counter deltas, which
measured exactly — 40 requests sent, 40 recorded. Then a deploy reset the counter
and the dashboard showed negative traffic. The reset-safe alternative,
increase(), overcounted by around 20% because it extrapolates at window edges.
Neither is right. The panels now use the reset-safe one and say plainly that the
figure is an estimate, with a note to query the database when an exact number
matters. A dashboard that is confidently wrong is worse than one that admits
what it does not know.
An hour spent looking in the wrong place. Every panel on two dashboards failed while the backend reported healthy and the query API returned correct rows. I tested three theories — browser cache, missing panel IDs, a malformed query object — and all three were wrong. The actual cause was that the newer datasource reads the database name from a nested config block while the backend still reads it from the top level. Setting only the top-level one produces exactly that split: green from the server, red in the UI. I had been testing the half that worked. The error text only existed in the browser, and I should have asked for it far sooner.
My own load test was lying to the service map. The script sent W3C trace
context on every request, which makes each server span look like it has a parent
— but curl never emits that parent span. The tracing backend then treats the
request as neither a root call nor a call from a known client, so all synthetic
traffic vanished from the dependency graph. The map was showing seven requests
where there were hundreds of thousands. The graph was not wrong; I was feeding it
something dishonest. The fix was to send trace context on only a fifth of
requests: enough to have known IDs to look up, while the rest count correctly.
The overview contradicted itself, and I published it. In the first screenshot
on this page, the top row read “Error rate 0.00%” next to “Exceptions 1,520” and
“Requests in range 38,614”. Those cannot all be true at once. The rate tiles
reduced a spiky series with last, so they reported the final instant of the
window — when the application happened to be idle — while the tiles beside them
counted the whole range. Across that range the real figure was 5.42%: 2,091
failed requests out of 38,614. Those tiles now compute over the range, and the
dashboard agrees with itself. What stings is not the mistake but its route: I
built the dashboard, read it for weeks, put it on this page, and the
contradiction was caught by the first person to look at the screenshot.
What I would do differently
Test against the interface people actually use. Most of the defects above survived my checks because I verified through APIs and the command line, where everything looked fine, and the failures only existed in the rendered UI.
And put the thing in front of someone else sooner. A dashboard you built is a dashboard you have stopped reading: you know what each tile means, so you see the meaning instead of the number. Every panel on this platform reconciles against the database now, but the tile that disagreed with the two beside it needed a fresh pair of eyes, not another check of mine.